Triplet RYME
Visitor Flow Analytics for Museums & Culture
When visitors are truly engaged, where they linger longest, and the exact moment attention drops off — exhibition operators need to know first.
Get Started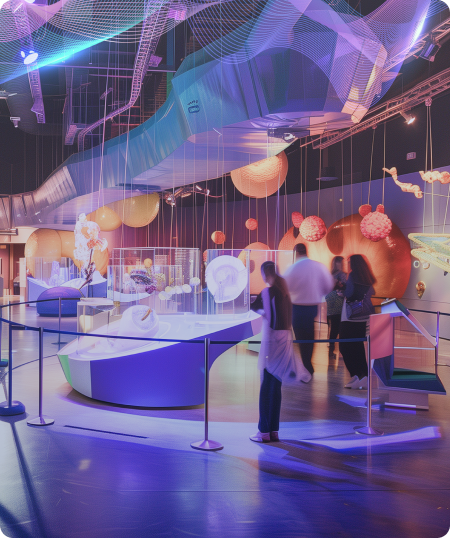 _intro_01.png
450 × 538
Recurring Problems
You know the visitor count, but explaining which exhibits actually hold visitors’ attention is far harder.
- There’s no way to quantify which exhibits are popular.
- You know the crowd favorites, but can’t explain why they draw attention.
- Exhibition improvements rely on intuition, with no systematic criteria being built for the next show.
How Triplet AI Understands Space
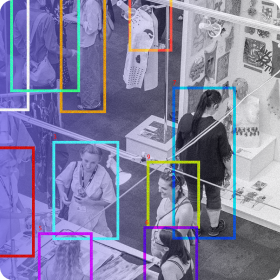
Triplet RYME records the flow of visitors within a space and organizes it into a format operators can act on immediately.
Not complex numbers — an intuitive view of what’s happening in the space right now.
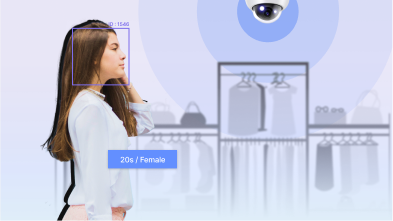
- Real-time visitor movement tracking
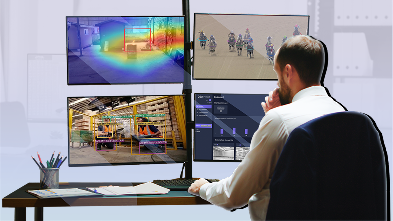
- Cumulative dwell & flow data by exhibit
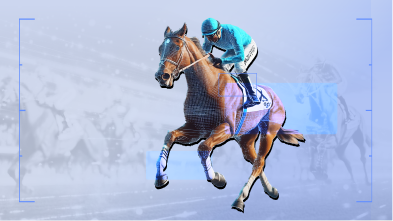
- Movement organized into understandable patterns
 _intro2_01.png
280 × 280
 _intro2_02.png
280 × 280
 _intro2_03.png
280 × 280
 _intro2_04.png
280 × 280
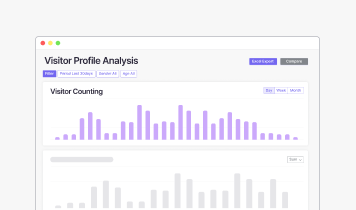
From real-time awareness to exhibit-level analysis and cumulative reports — we provide the benchmarks operators need.
We provide benchmarks for operational decisions.
 _tab_01.png
546 × 600
 _tab_02.png
546 × 600
 _tab_03.png
546 × 600
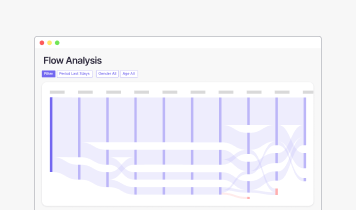
Structural analytics
built for exhibitions
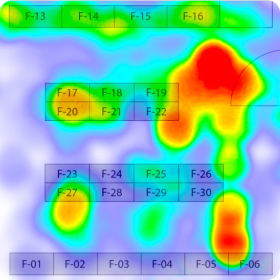
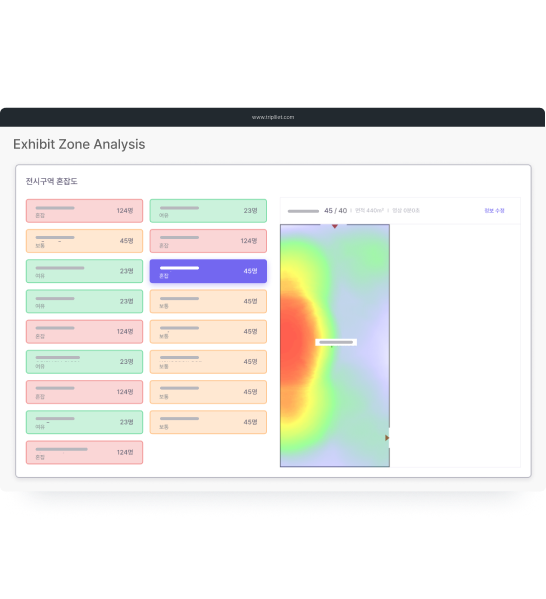
We read visitor interest in each exhibit through data.
- Identify where visitors linger and revisit.
- Visualize visitor engagement by zone.
- Jointly analyzes entry/exit flows and internal movement patterns to pre-identify zones where congestion and visitor discomfort build up.
 ryme_g_mid.png
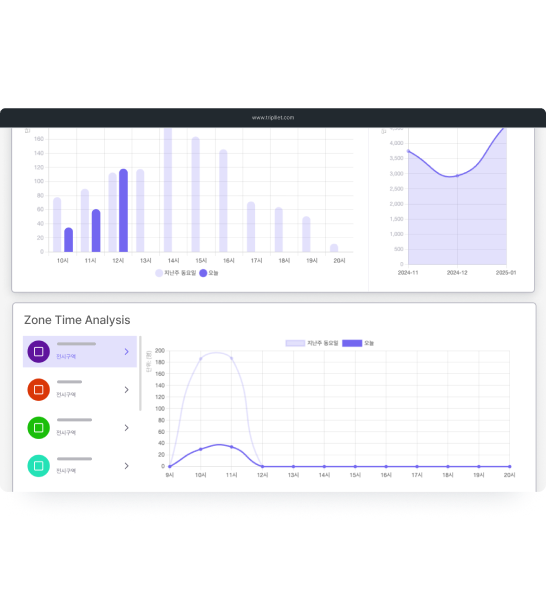
Building benchmarks for decision
We make the changes happening inside a space understandable — so operators can act on them.
 ryme_g_card_01.png
356 × 210
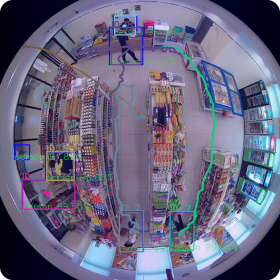
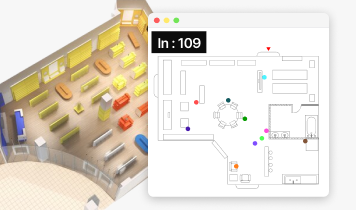
1. We observe movement within the space.
Not raw camera footage — movement abstracted onto floor plans for clear visualization.
 ryme_g_card_02.png
356 × 210
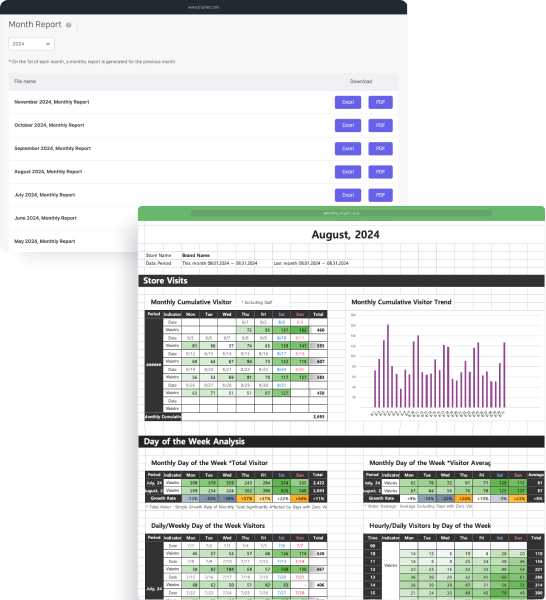
2. We remember the patterns.
We store daily flow as comparable data. Not one-off stats—accumulated by day, hour, session, and season to build operational benchmarks.
 ryme_g_card_03.png
356 × 210
3. We interpret why things change — as patterns.
We distill a space’s rhythm into explainable patterns.
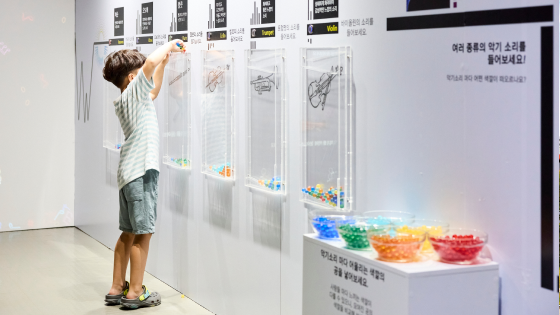
Real-World Applications
We can’t tell which exhibits visitors actually spend time at — and which ones they just walk past.
 _challenge_01.png
560 × 315
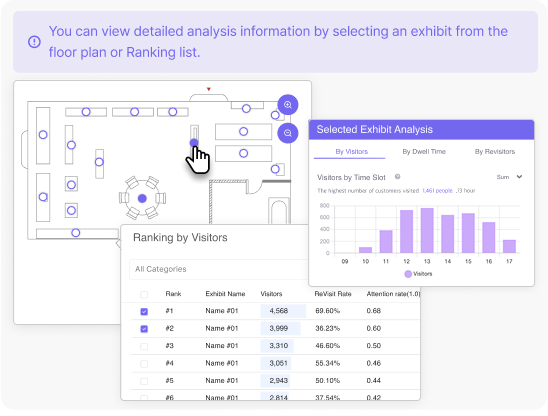
Records dwell time and visit frequency per exhibit, zone by zone.
Compares zones with short dwell and fast pass-through against zones with long dwell and repeat visits — structurally identifying differences in engagement.
Curators can adjust exhibit placement and routing based on data, not intuition.
After Implementation
- Average dwell time and variance per exhibit visualized
- Auto-classification of high- and low-engagement exhibits
- Exhibition planning validation prep time: 8 hrs → 3.5 hrs
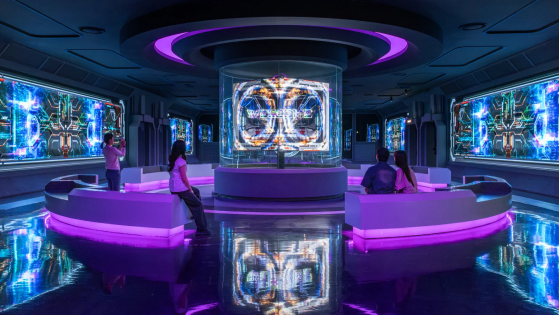
If certain zones see repeat visits, we want to understand why — and carry that insight into the next exhibition.
 _challenge_02.png
560 × 315
Accumulates zone-level revisit rates and movement patterns by day, hour, and session.
Identifies common traits of high-revisit zones — location, exhibit type, routing structure — organized as patterns that serve as evidence for planning the next show.
After Implementation
- Visualize revisit rate trends by zone
- Auto-extract common traits of high-revisit zones
- Placement evidence utilization rate for next exhibition: over 70%
USE CASE
 ryme_g_usecase_01.png
National Busan Science Museum
 ryme_g_usecase_02.png
L'Espace
 ryme_g_usecase_03.png
Bugae Library
 _cta_bg.png
1200 × 400
Try it out
with a demo walkthrough.
Some features may be limited.
Request a Demo