Triplet RYME
Queue Congestion Analytics
Triplet RYME analyzes queue patterns and seating flow together, helping operators respond faster and with greater precision.
Get Started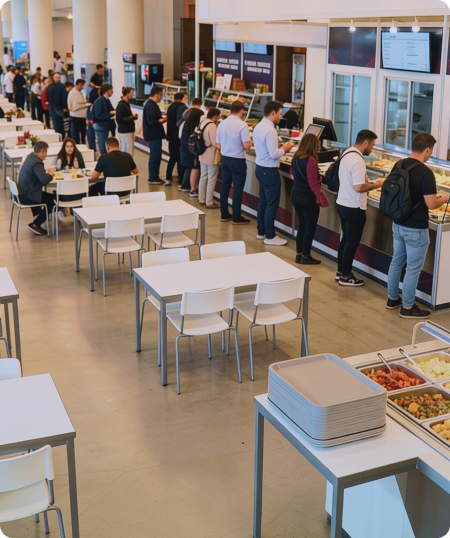 _intro_01.png
450 × 538
Recurring Problems
Visitors can’t tell which courts have long lines without physically being there.
- Visitors can’t tell which courts have long lines without physically being there.
- Seating and queue congestion repeats daily, yet actual turnover rates and wait times remain unknown.
- Inability to provide estimated wait times leads to recurring visitor complaints.
How Triplet AI
understands queues
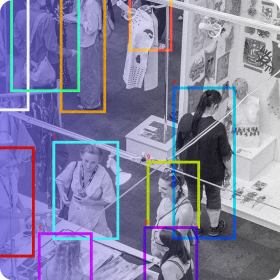
Triplet RYME records the flow of visitors within a space and organizes it into a format operators can act on immediately.
Not complex numbers — an intuitive view of what’s happening in the space right now.
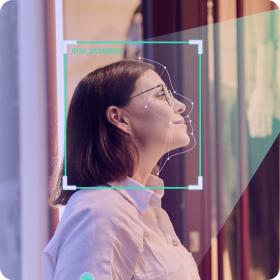
- Real-time visitor movement tracking
- Cumulative queue/dwell/turnover flow data
- Organize flow into understandable patterns
 _intro2_01.png
280 × 280
 _intro2_02.png
280 × 280
 _intro2_03.png
280 × 280
 _intro2_04.png
280 × 280
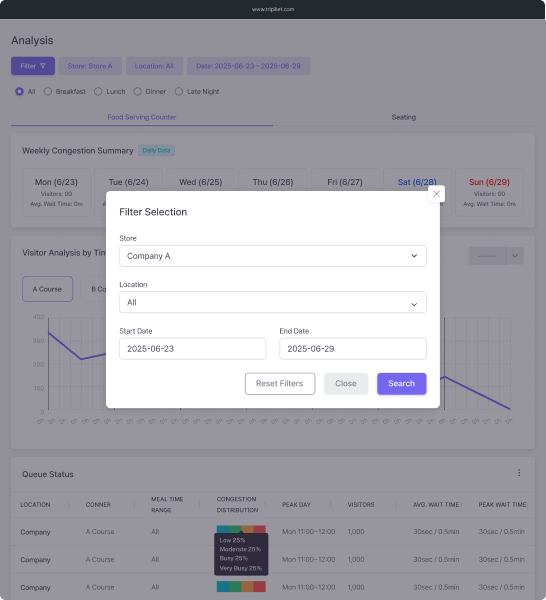
From real-time situational awareness to queue analysis and cumulative reports — we provide the benchmarks operators need.
We provide benchmarks for operational decisions.
 _tab_01.png
546 × 600
 _tab_02.png
546 × 600
 _tab_03.png
546 × 600
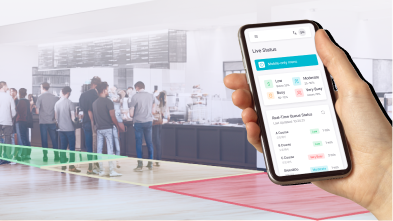
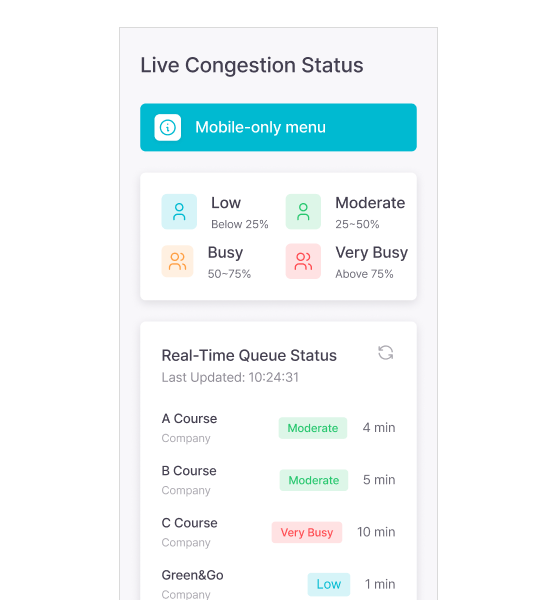
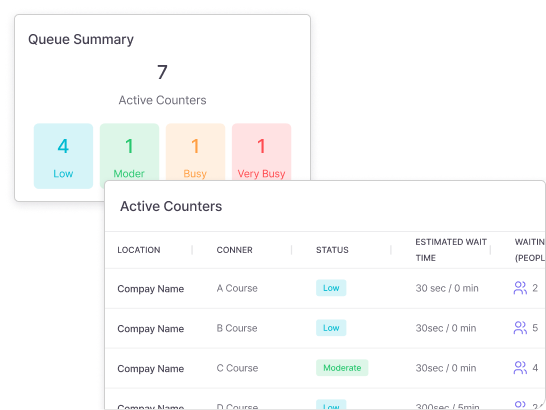
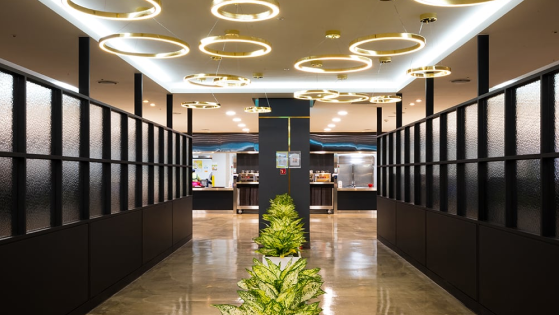
Congestion analytics AI for smarter queue and seating management
Optimized for spaces where queuing is structurally unavoidable — like corporate cafeterias and airport food courts.
- Real-time queue counts by court and zone.
- Auto-calculate estimated wait times for visitors.
- Instant alerts when queue thresholds exceeded.
 ryme_q_mid.png
Setting the standard for spaces
 ryme_q_card_01.png
356 × 210
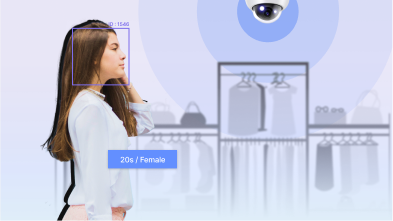
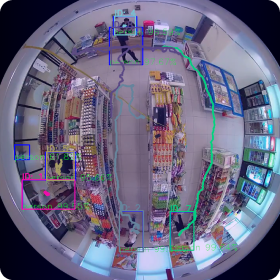
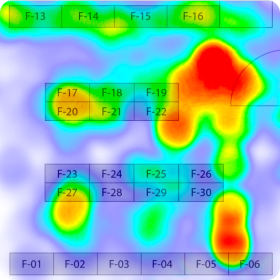
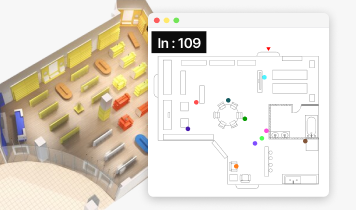
1. We observe movement within the space.
Not raw camera footage — movement abstracted onto floor plans for clear visualization.
 ryme_q_card_02.png
356 × 210
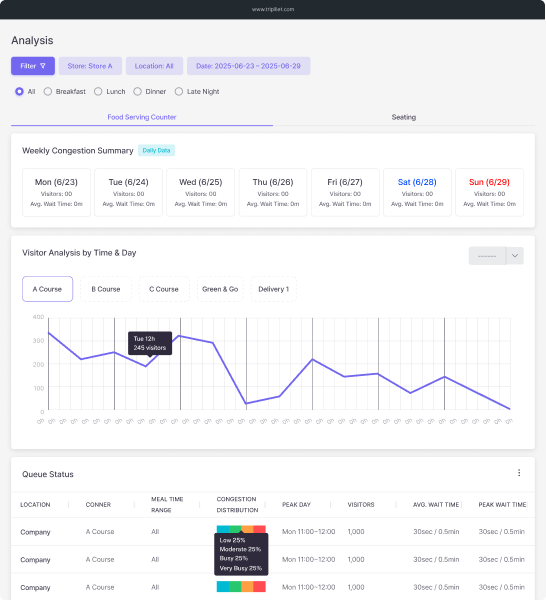
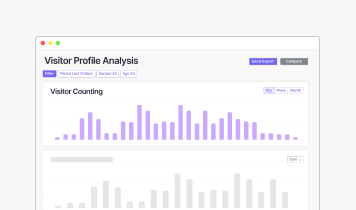
2. We remember the patterns.
We store daily flow as comparable data. Not one-off stats—accumulated by day, hour, session, and season to build operational benchmarks.
 ryme_q_card_03.png
356 × 210
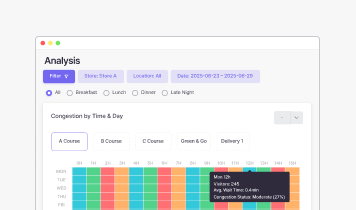
3. We interpret why things change — as patterns.
We distill a space’s rhythm into explainable patterns.
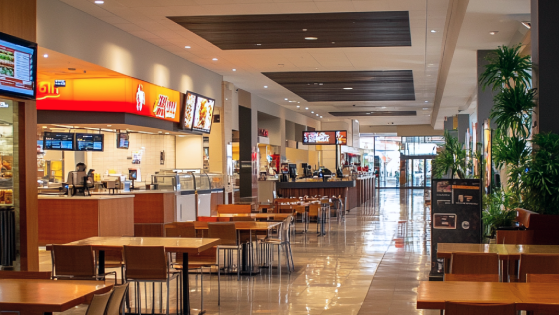
Real-World Applications
The lunch rush hits hard, and we’re left guessing which court gets backed up first.
 _challenge_01.png
560 × 315
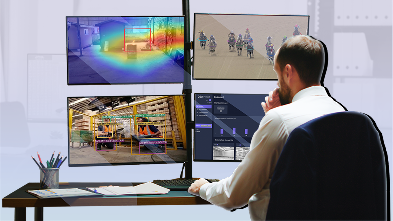
Visualize inflow/queue/exit flow by court in real-time.
Detect when and where queue density starts building up.
After Implementation
- Real-time queue visualization by court improves user experience
- Reduced frequency of sudden on-site chaos
- Relieve overcrowding at specific courts and distribute flow
Food waste keeps rising, but there’s no data on which menu items are actually preferred.
 _challenge_02.png
560 × 315
Structure actual consumption behavior based on food waste data.
Analyze not just sales volume, but seat turnover to distinguish popular vs operationally efficient menus.
After Implementation
- Menu planning shifts from intuition-based to evidence-based
- Clearer operational decisions: popular menu placement, waste reduction
USE CASE
 ryme_q_usecase_01.png
Hyundai Motor
 ryme_q_usecase_02.png
F&F
 ryme_q_usecase_03.png
Hyundai Mobis
 ryme_q_usecase_04.png
Hyundai AutoEver
 ryme_q_usecase_05.png
Kia Motors
 ryme_q_usecase_06.png
SK하이닉스
 _cta_bg.png
1200 × 400
Try it out
with a demo walkthrough.
Some features may be limited.
Request a Demo